
Point your shippers here
OTLP over HTTP for logs and traces, JSON events, the Elasticsearch bulk API and Splunk HEC. Change the host and key in the config you have; Send data here fills in the snippet.
SQL editor, dashboards, pipelines, cluster monitoring, governance and an AI copilot. One binary on your infrastructure, and your data never leaves it.
$ curl -L -o ch-ui \ https://github.com/caioricciuti/ch-ui/releases/latest/download/ch-ui-linux-amd64$ chmod +x ch-ui && ./ch-uiServer listening on http://localhost:3488$ curl -L -o ch-ui \ https://github.com/caioricciuti/ch-ui/releases/latest/download/ch-ui-linux-arm64$ chmod +x ch-ui && ./ch-uiServer listening on http://localhost:3488$ curl -L -o ch-ui \ https://github.com/caioricciuti/ch-ui/releases/latest/download/ch-ui-darwin-arm64$ chmod +x ch-ui && ./ch-uiServer listening on http://localhost:3488$ Invoke-WebRequest -OutFile ch-ui.exe ` https://github.com/caioricciuti/ch-ui/releases/latest/download/ch-ui-windows-amd64.exe$ .\ch-ui.exe desktopCH-UI desktop is running at http://127.0.0.1:3488$ docker run --name ch-ui -p 3488:3488 \ -v ch-ui-data:/app/data \ --add-host host.docker.internal:host-gateway \ -e CLICKHOUSE_URL=http://host.docker.internal:8123 \ ghcr.io/caioricciuti/ch-ui:latestOpen http://localhost:3488$ docker logs ch-ui 2>&1 | grep setup_codeOnly if sign-in fails: the one-time setup codeThat is the entire install: one binary, state in a local SQLite file, no other services.
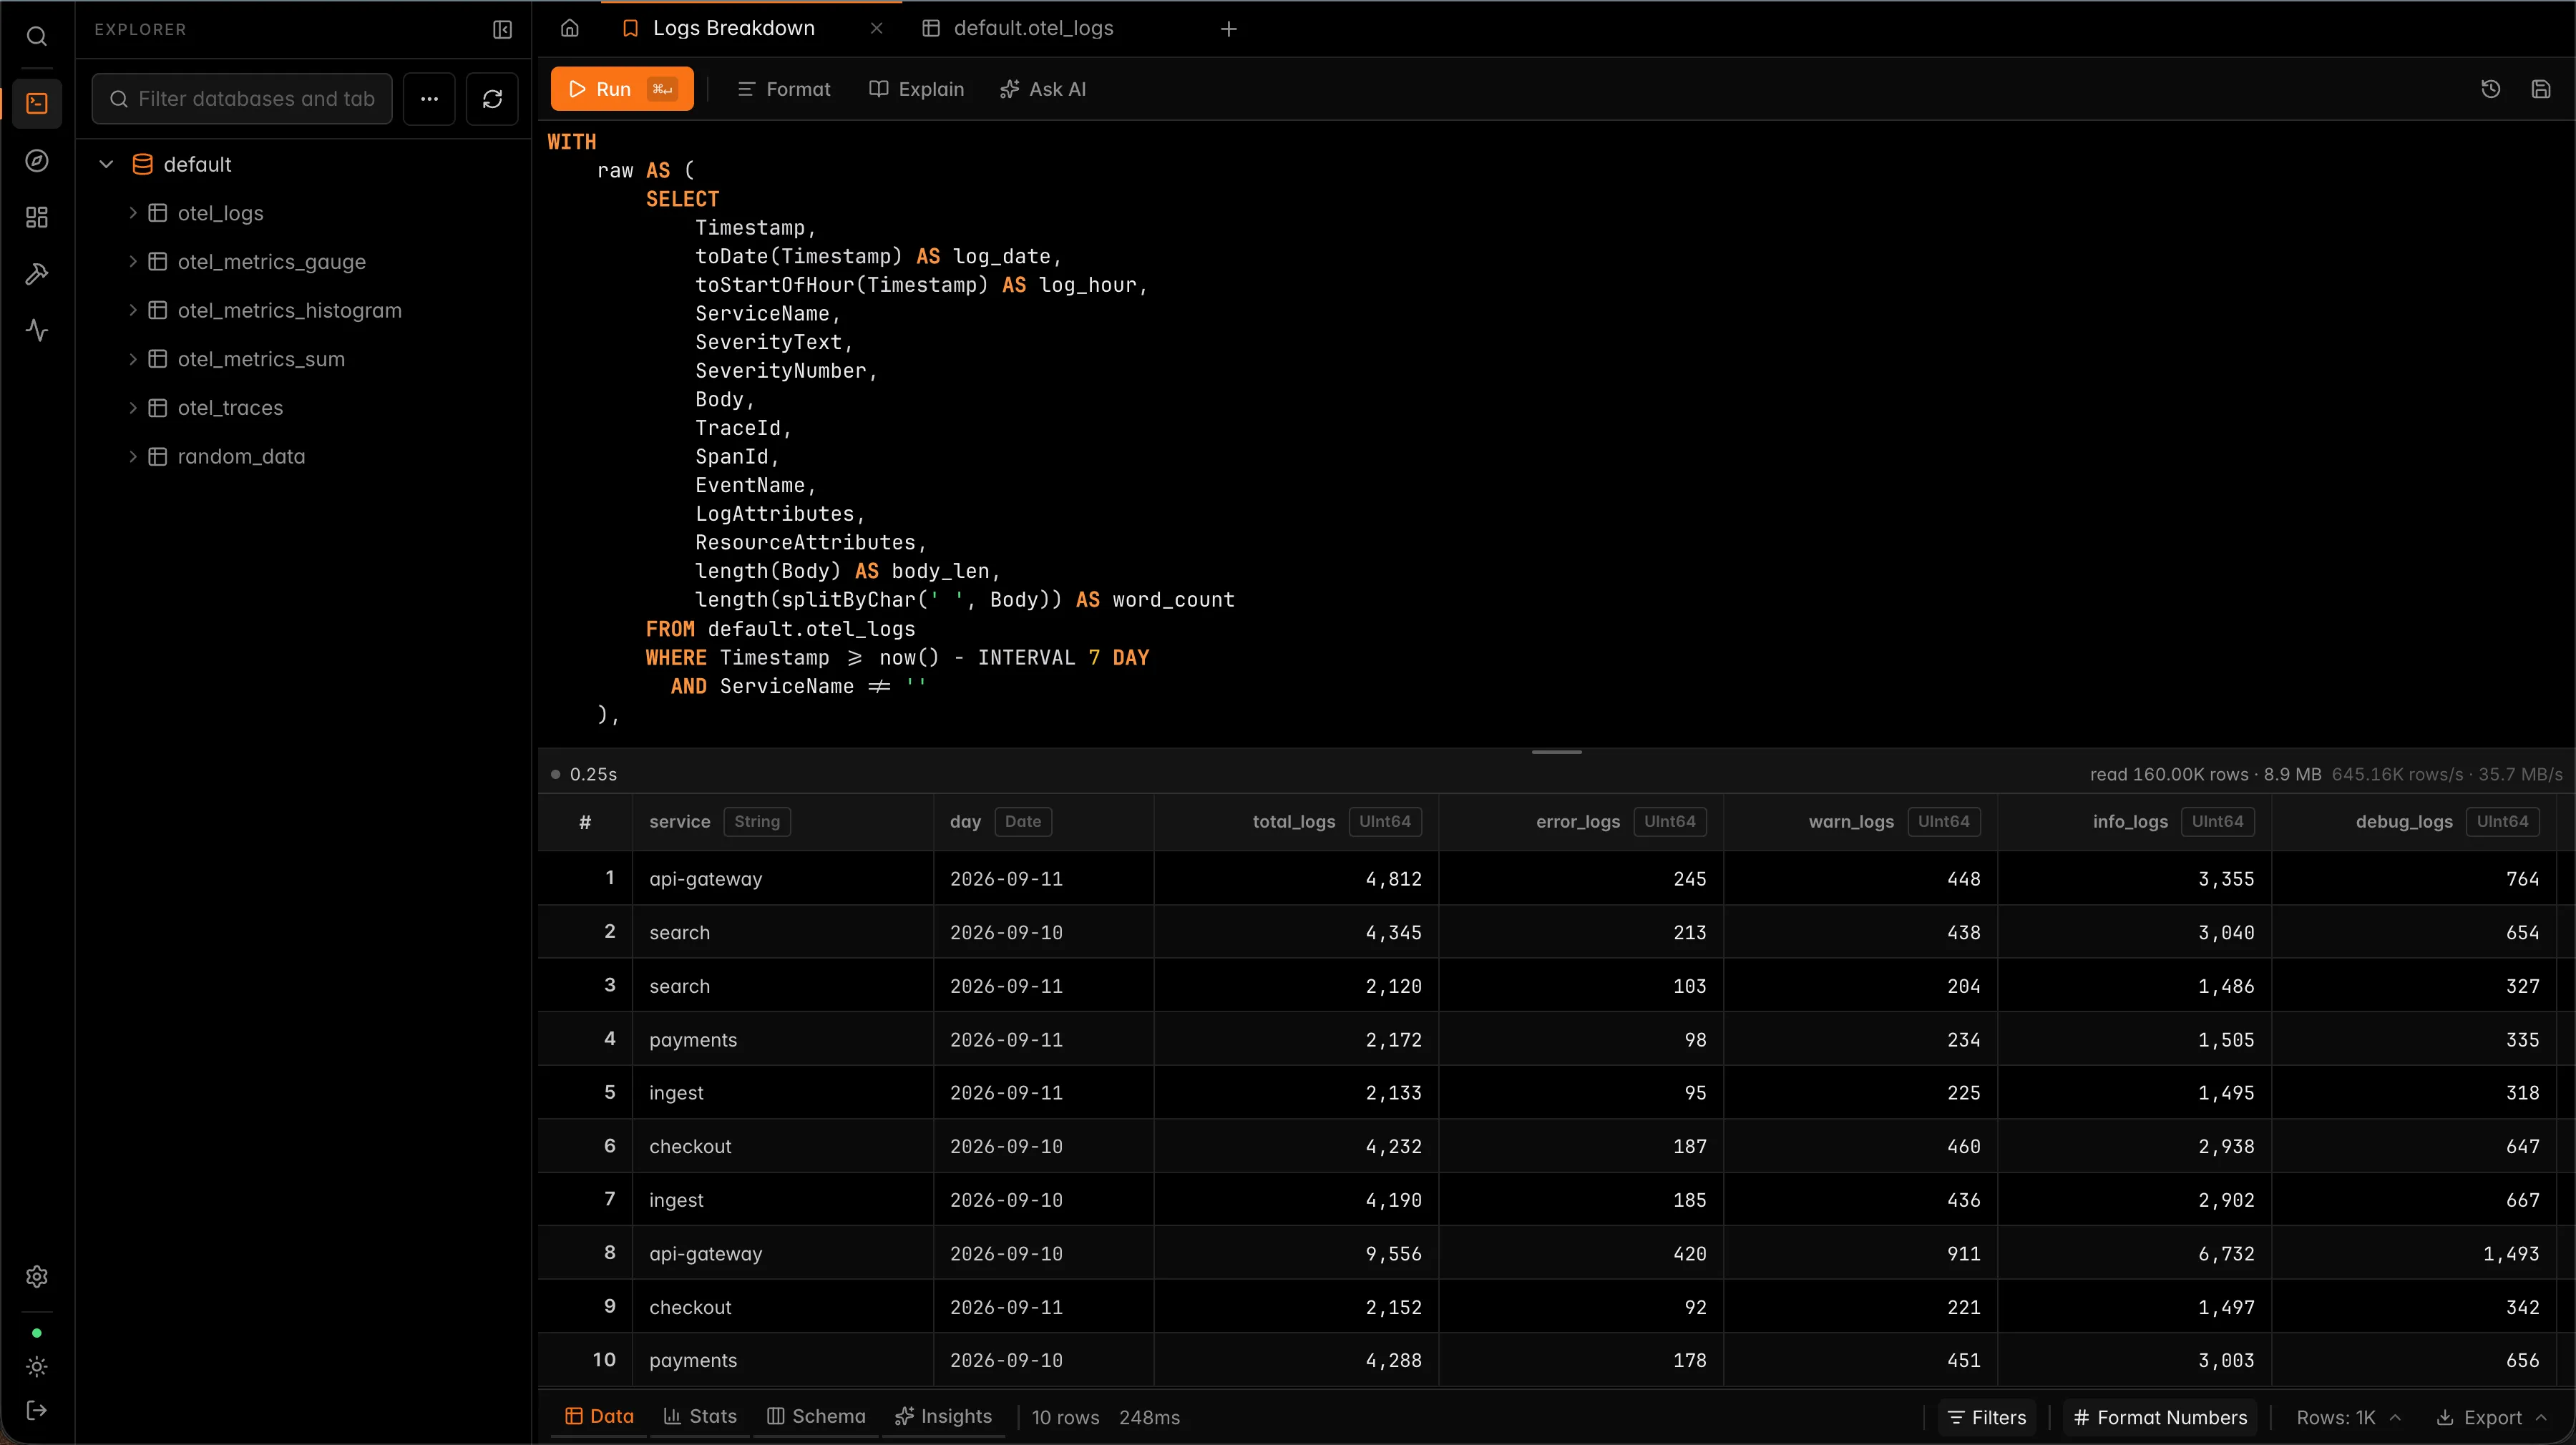
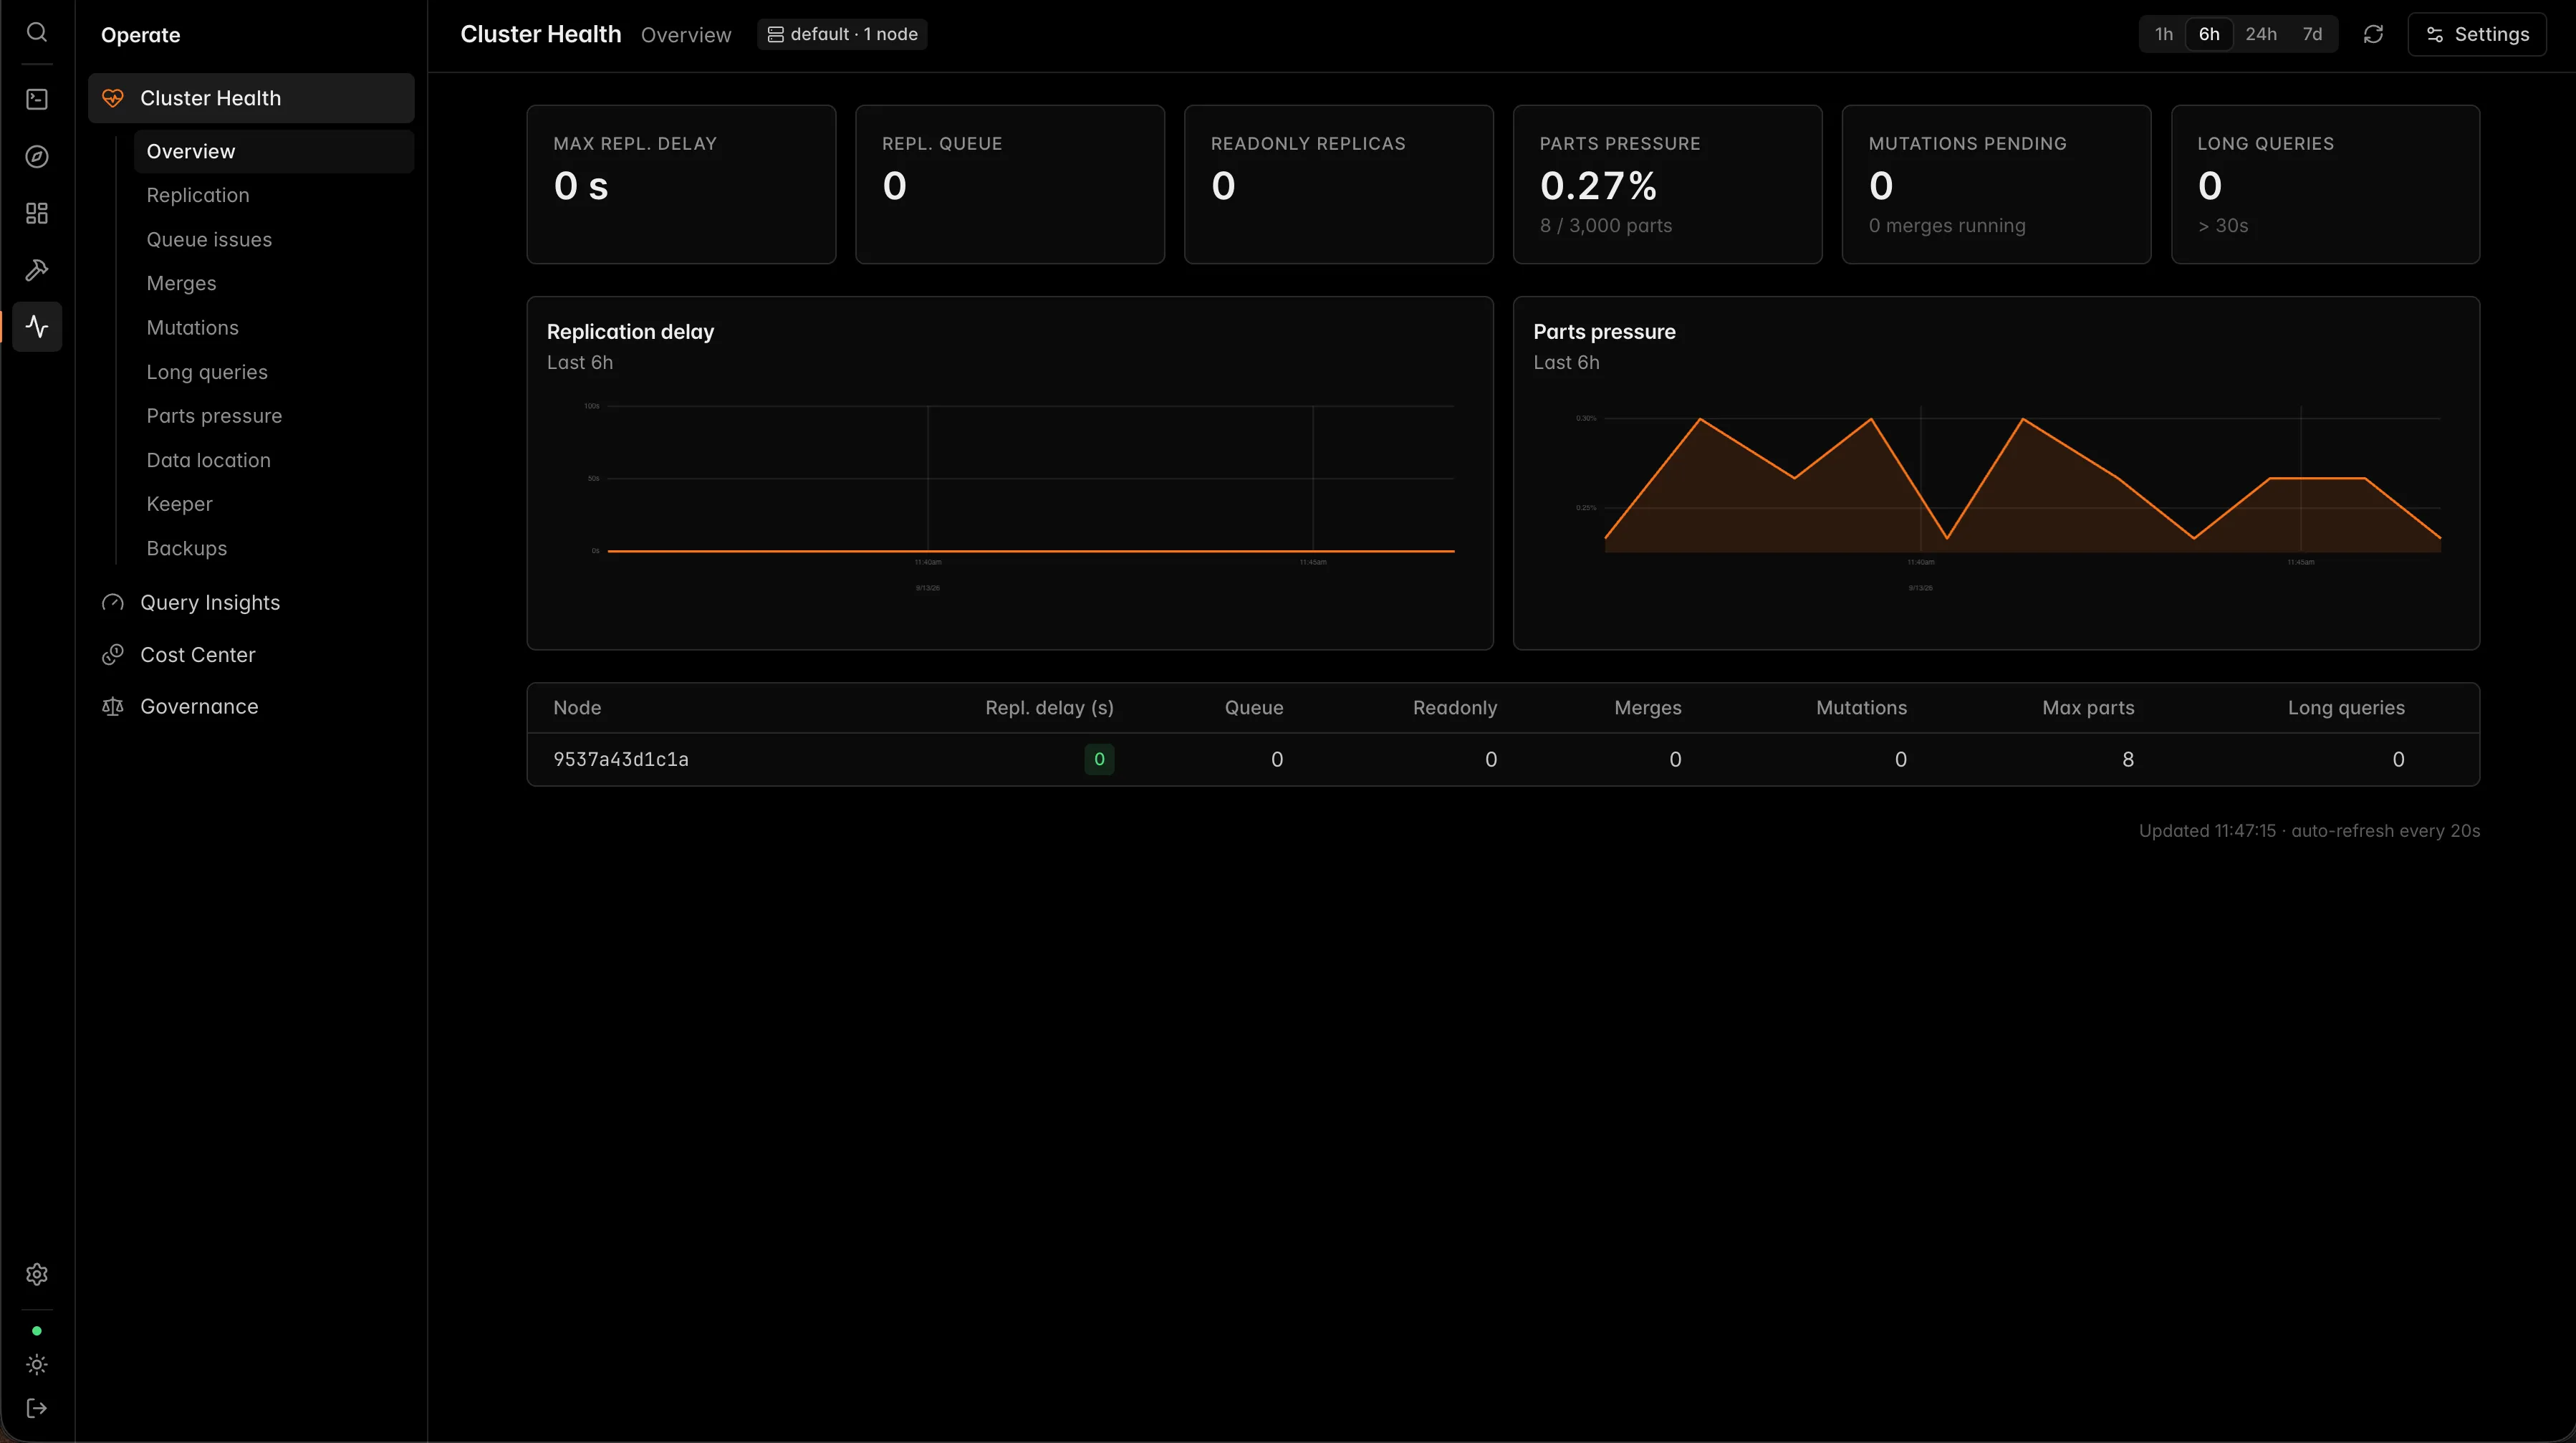
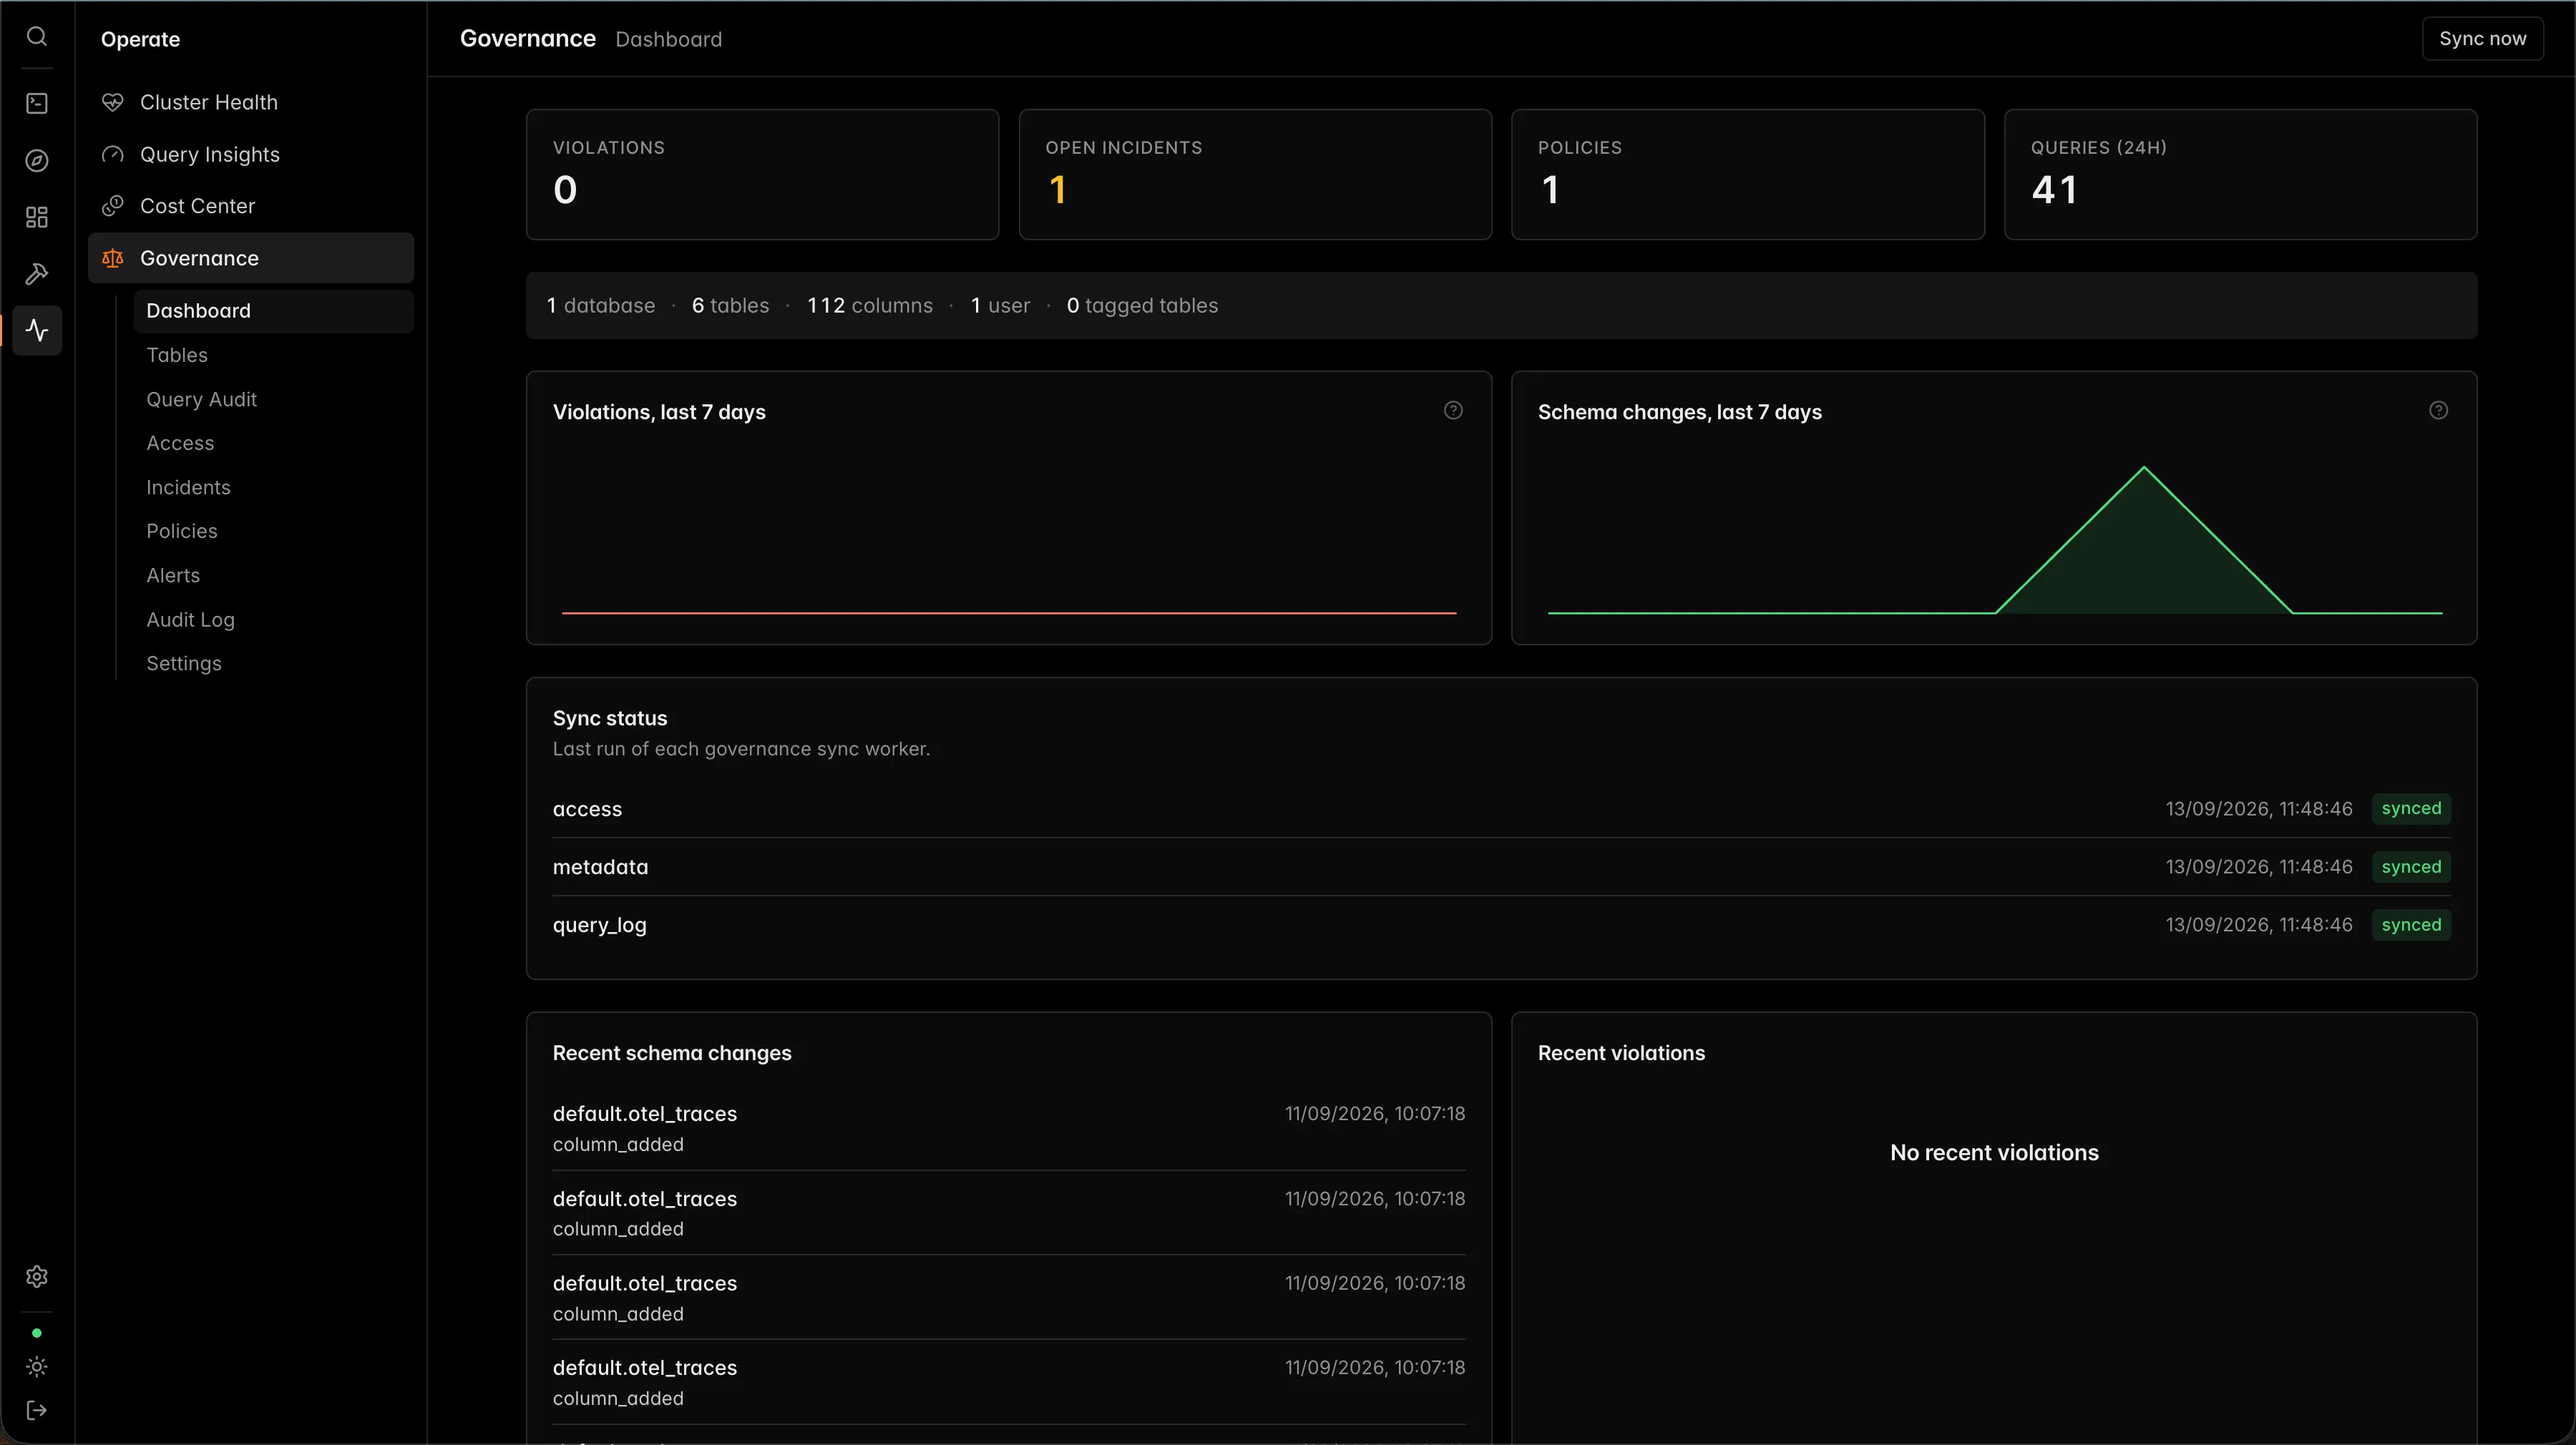
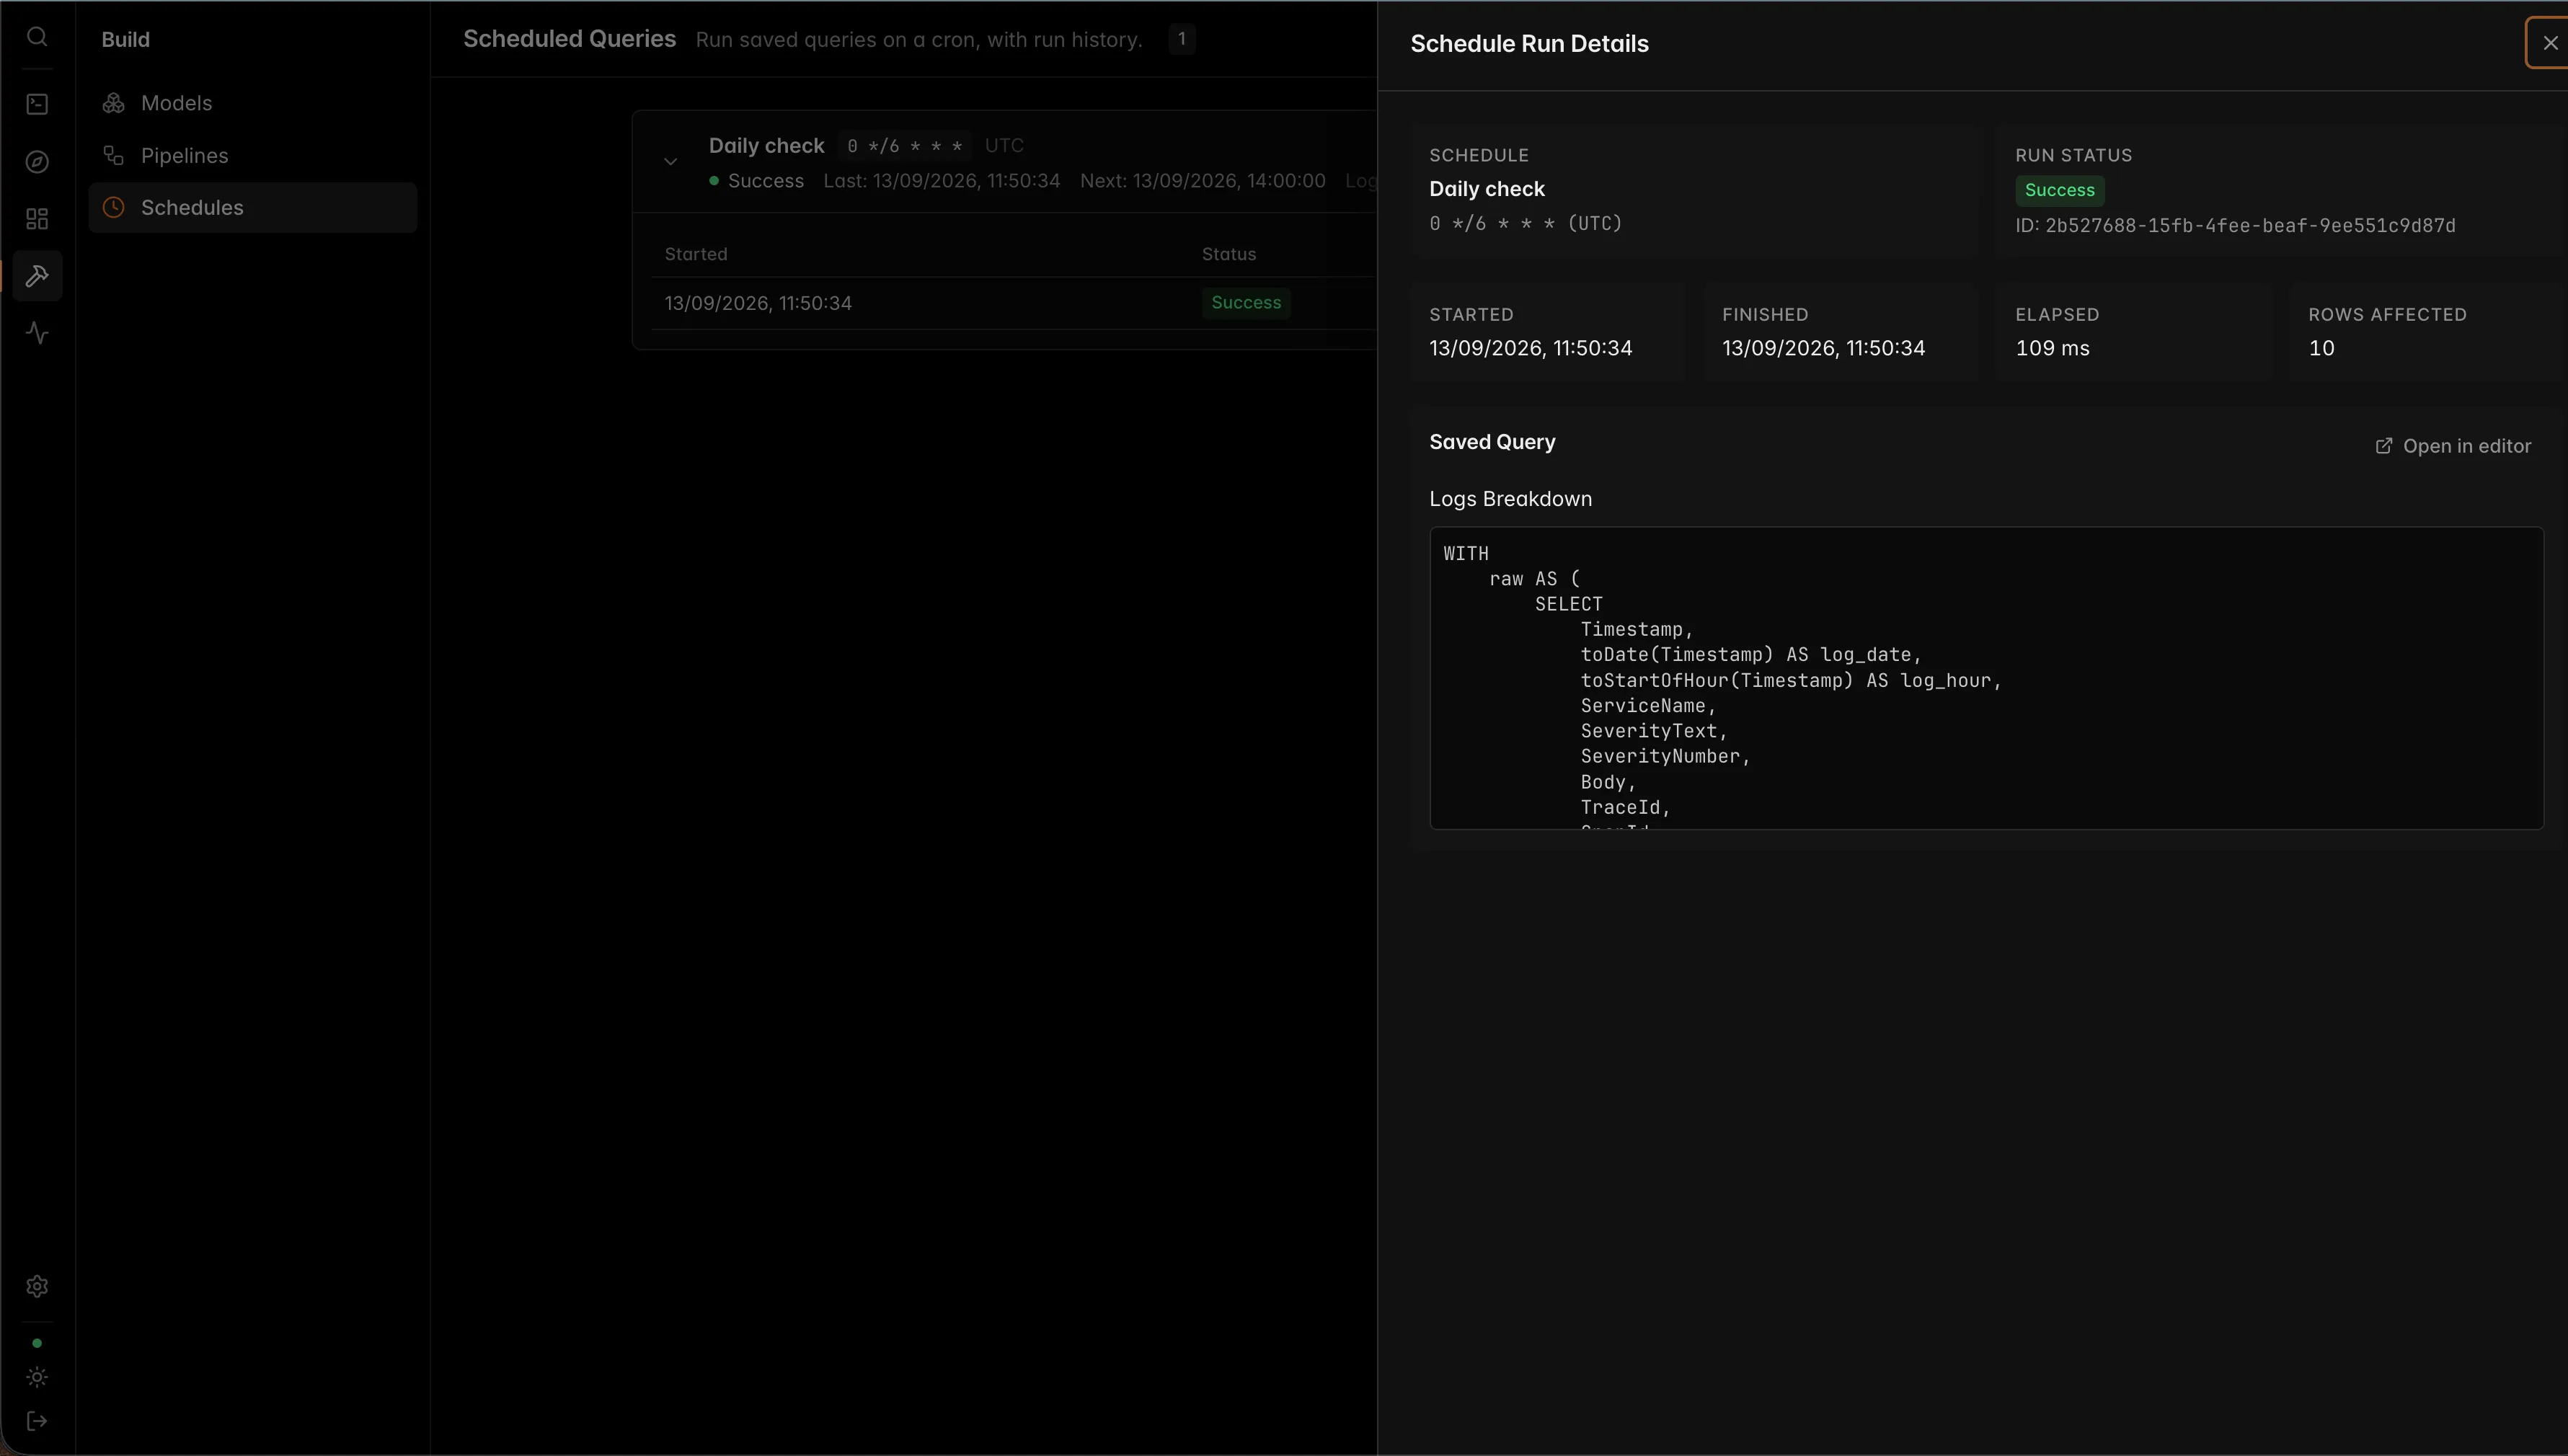
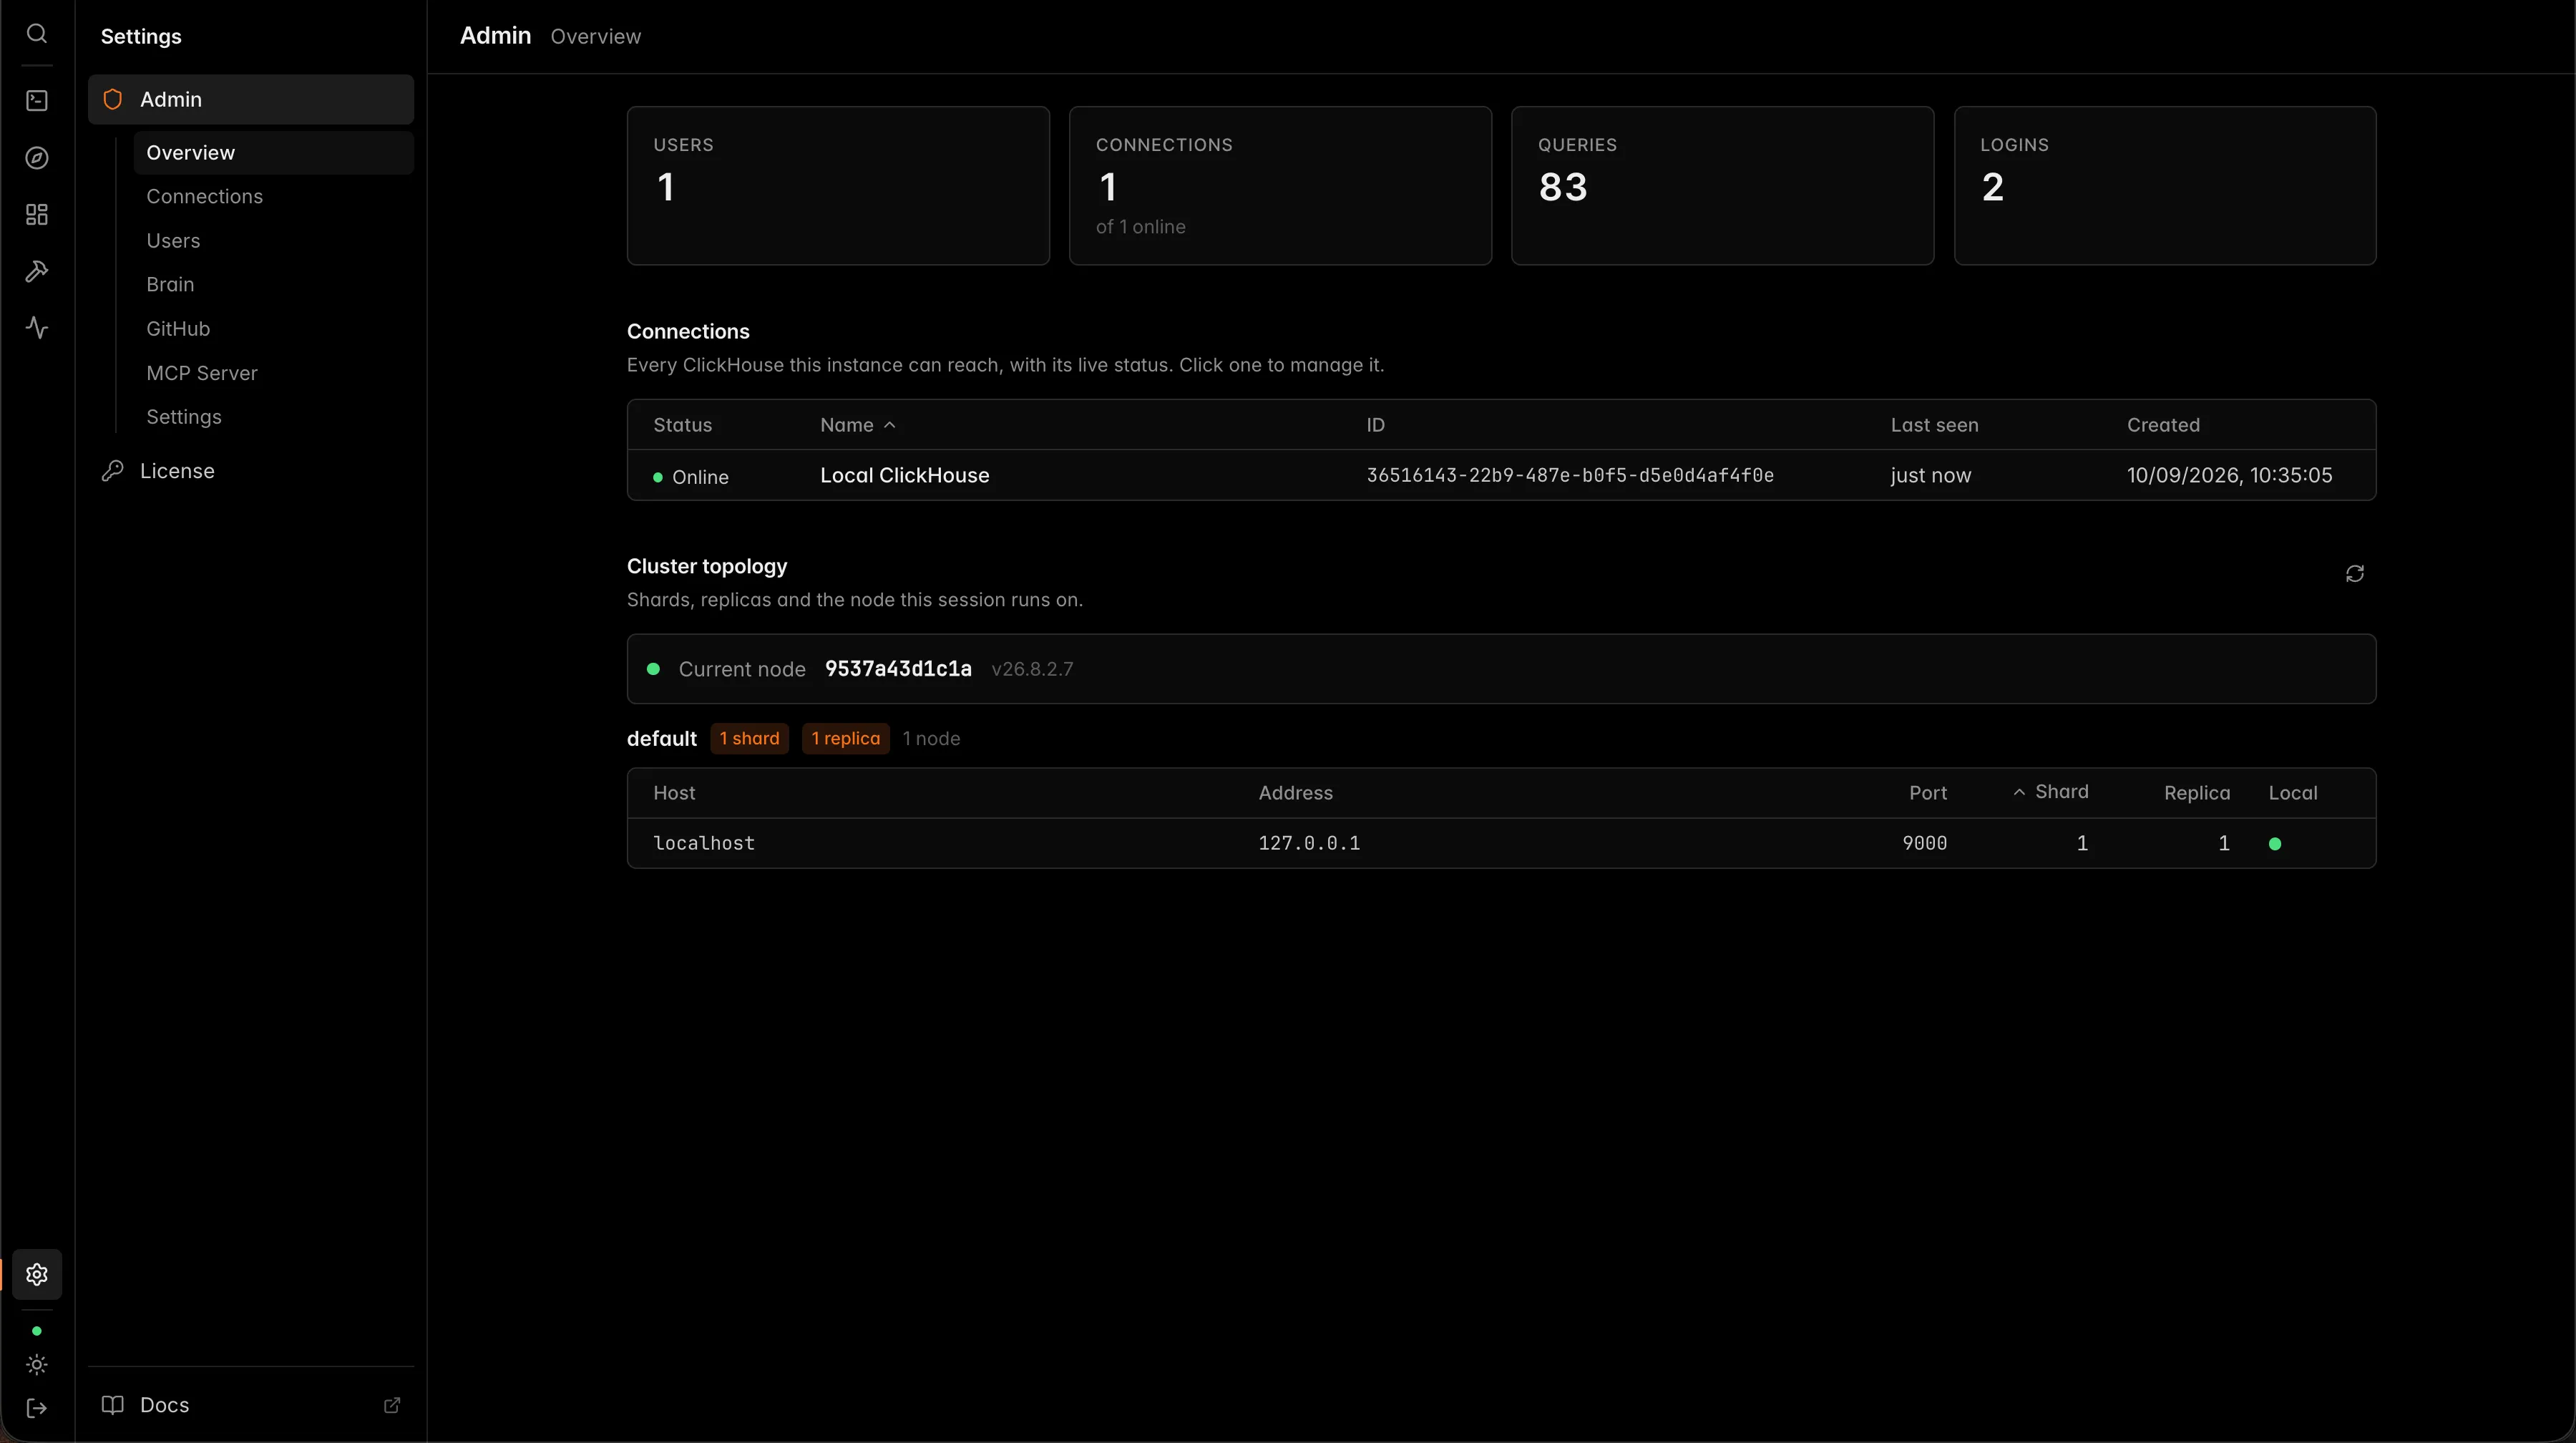
Multi-tab editing with streaming results, sort and filter on results, automatic query history, and errors that jump to the failing line.Read the docs
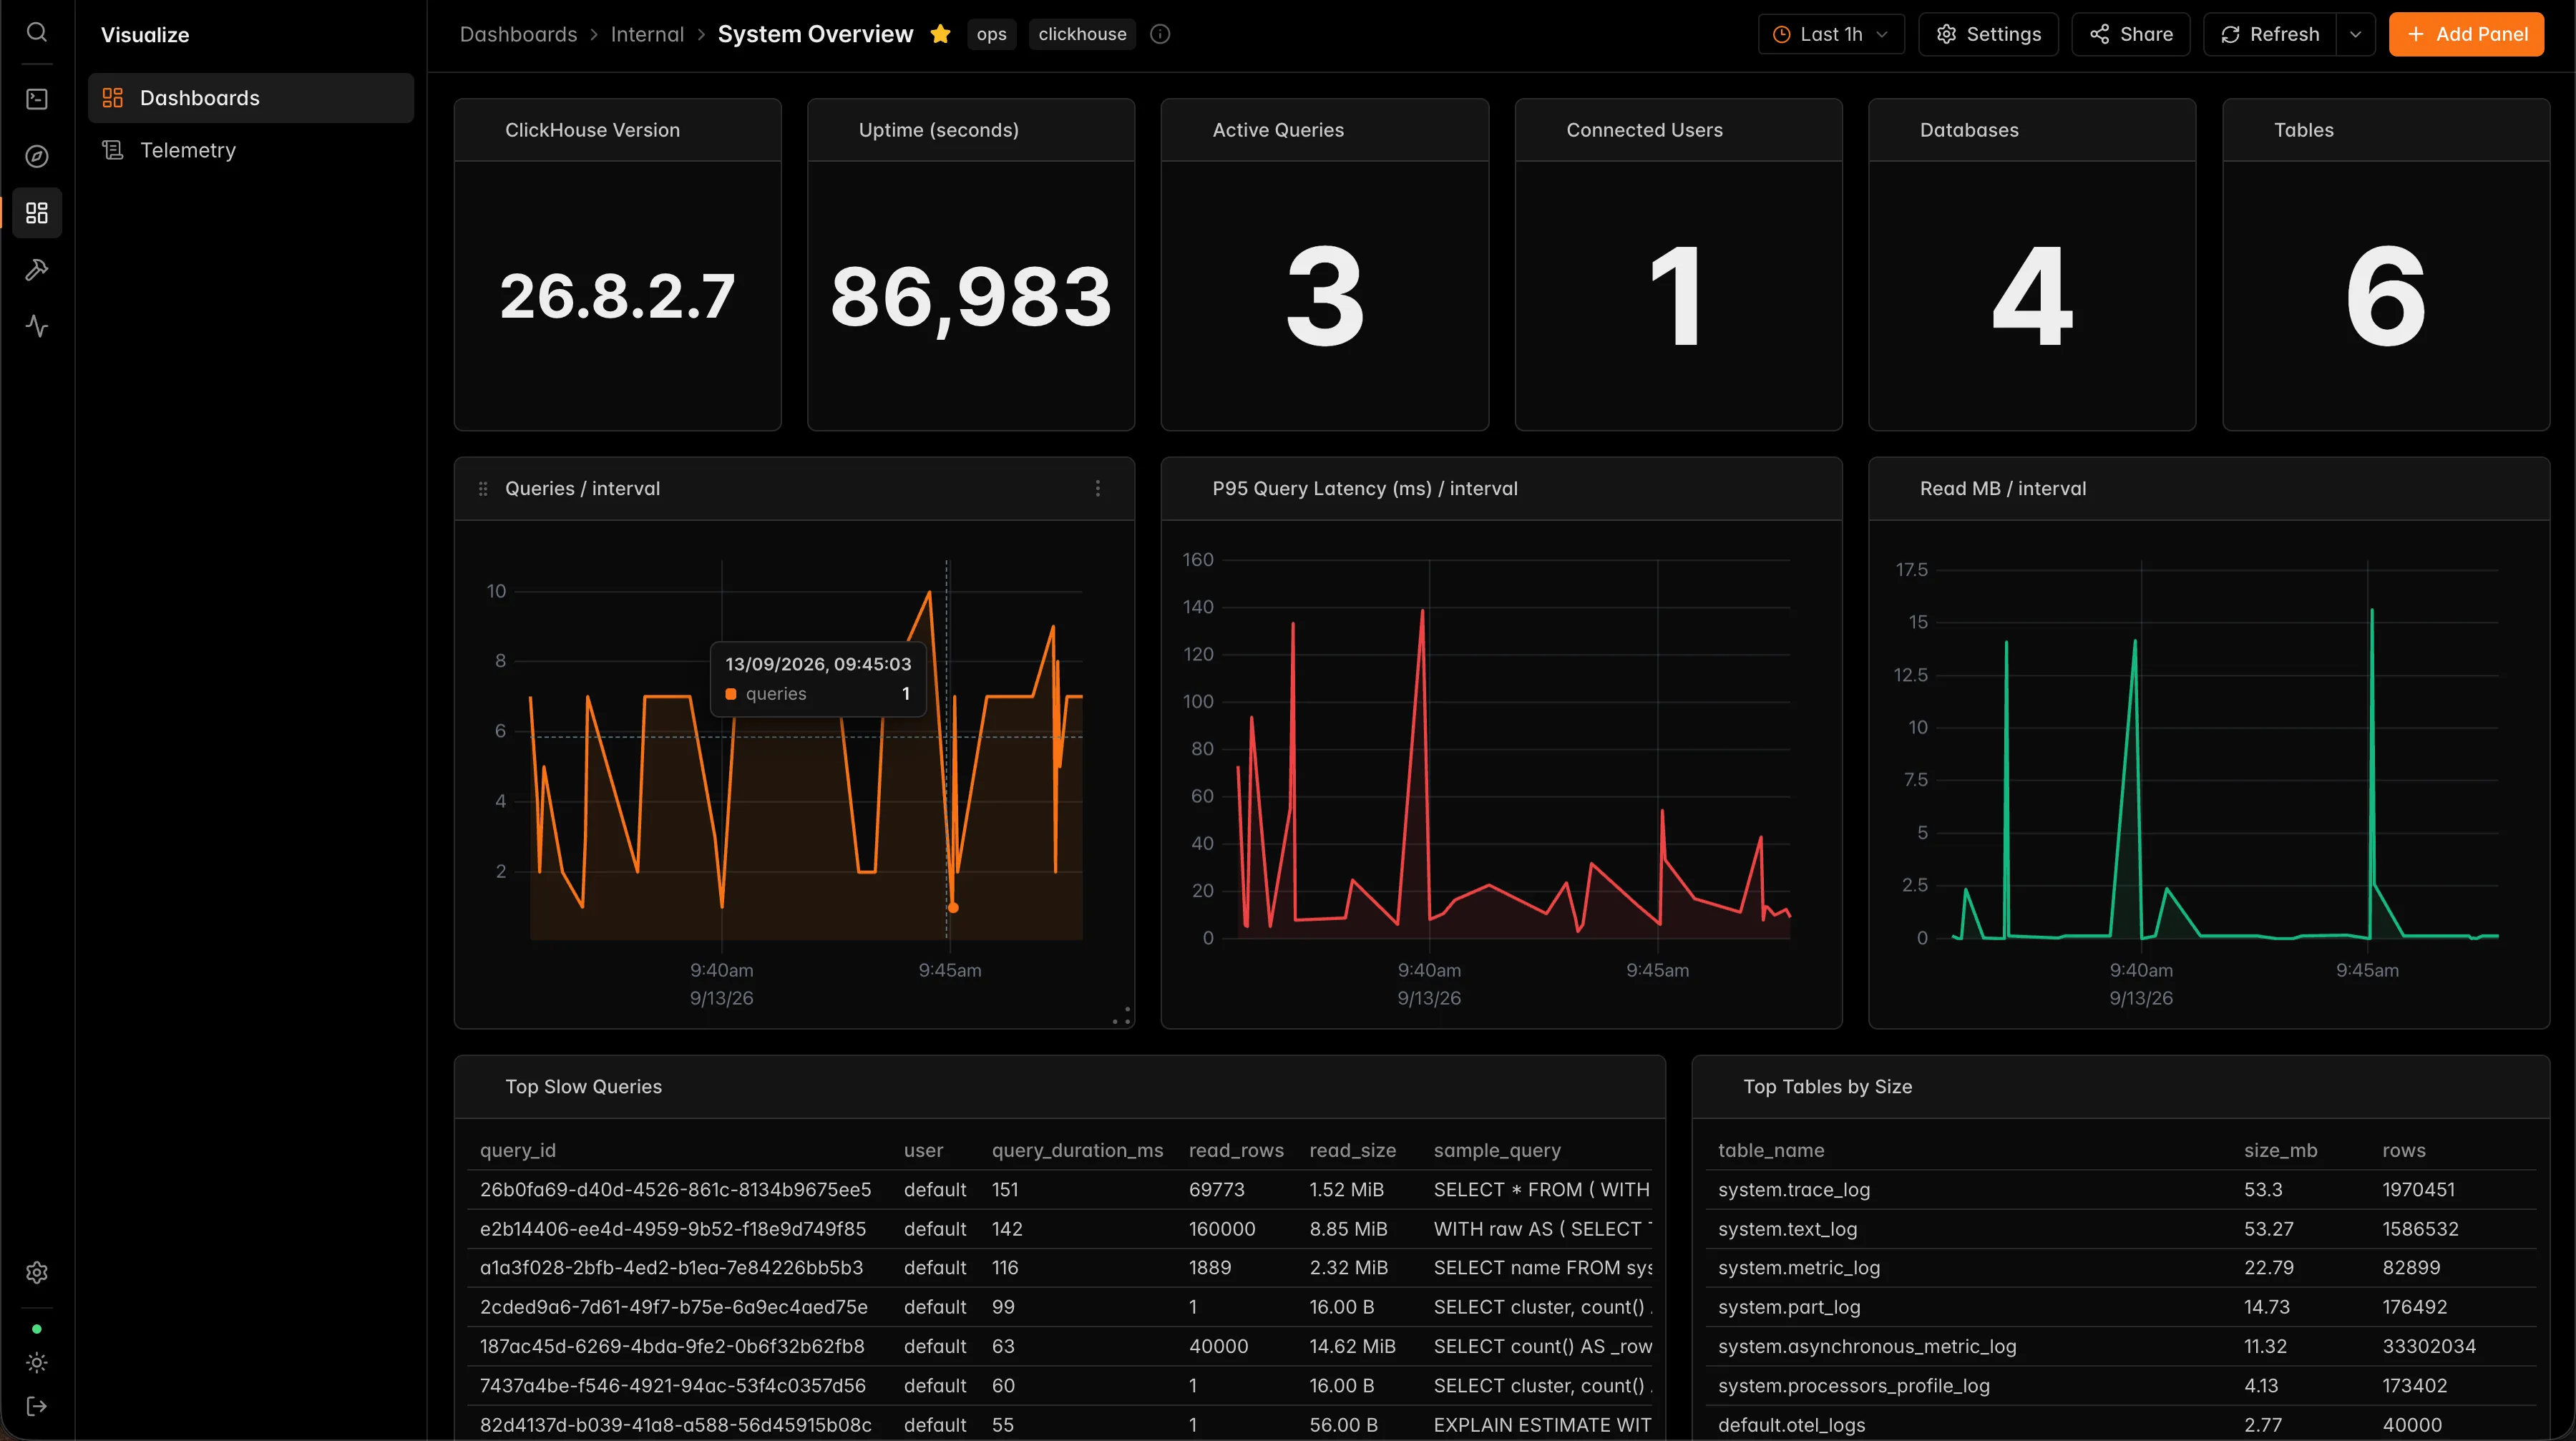
Build panels from saved queries, arrange layouts, and share system overviews across your team.Read the docs
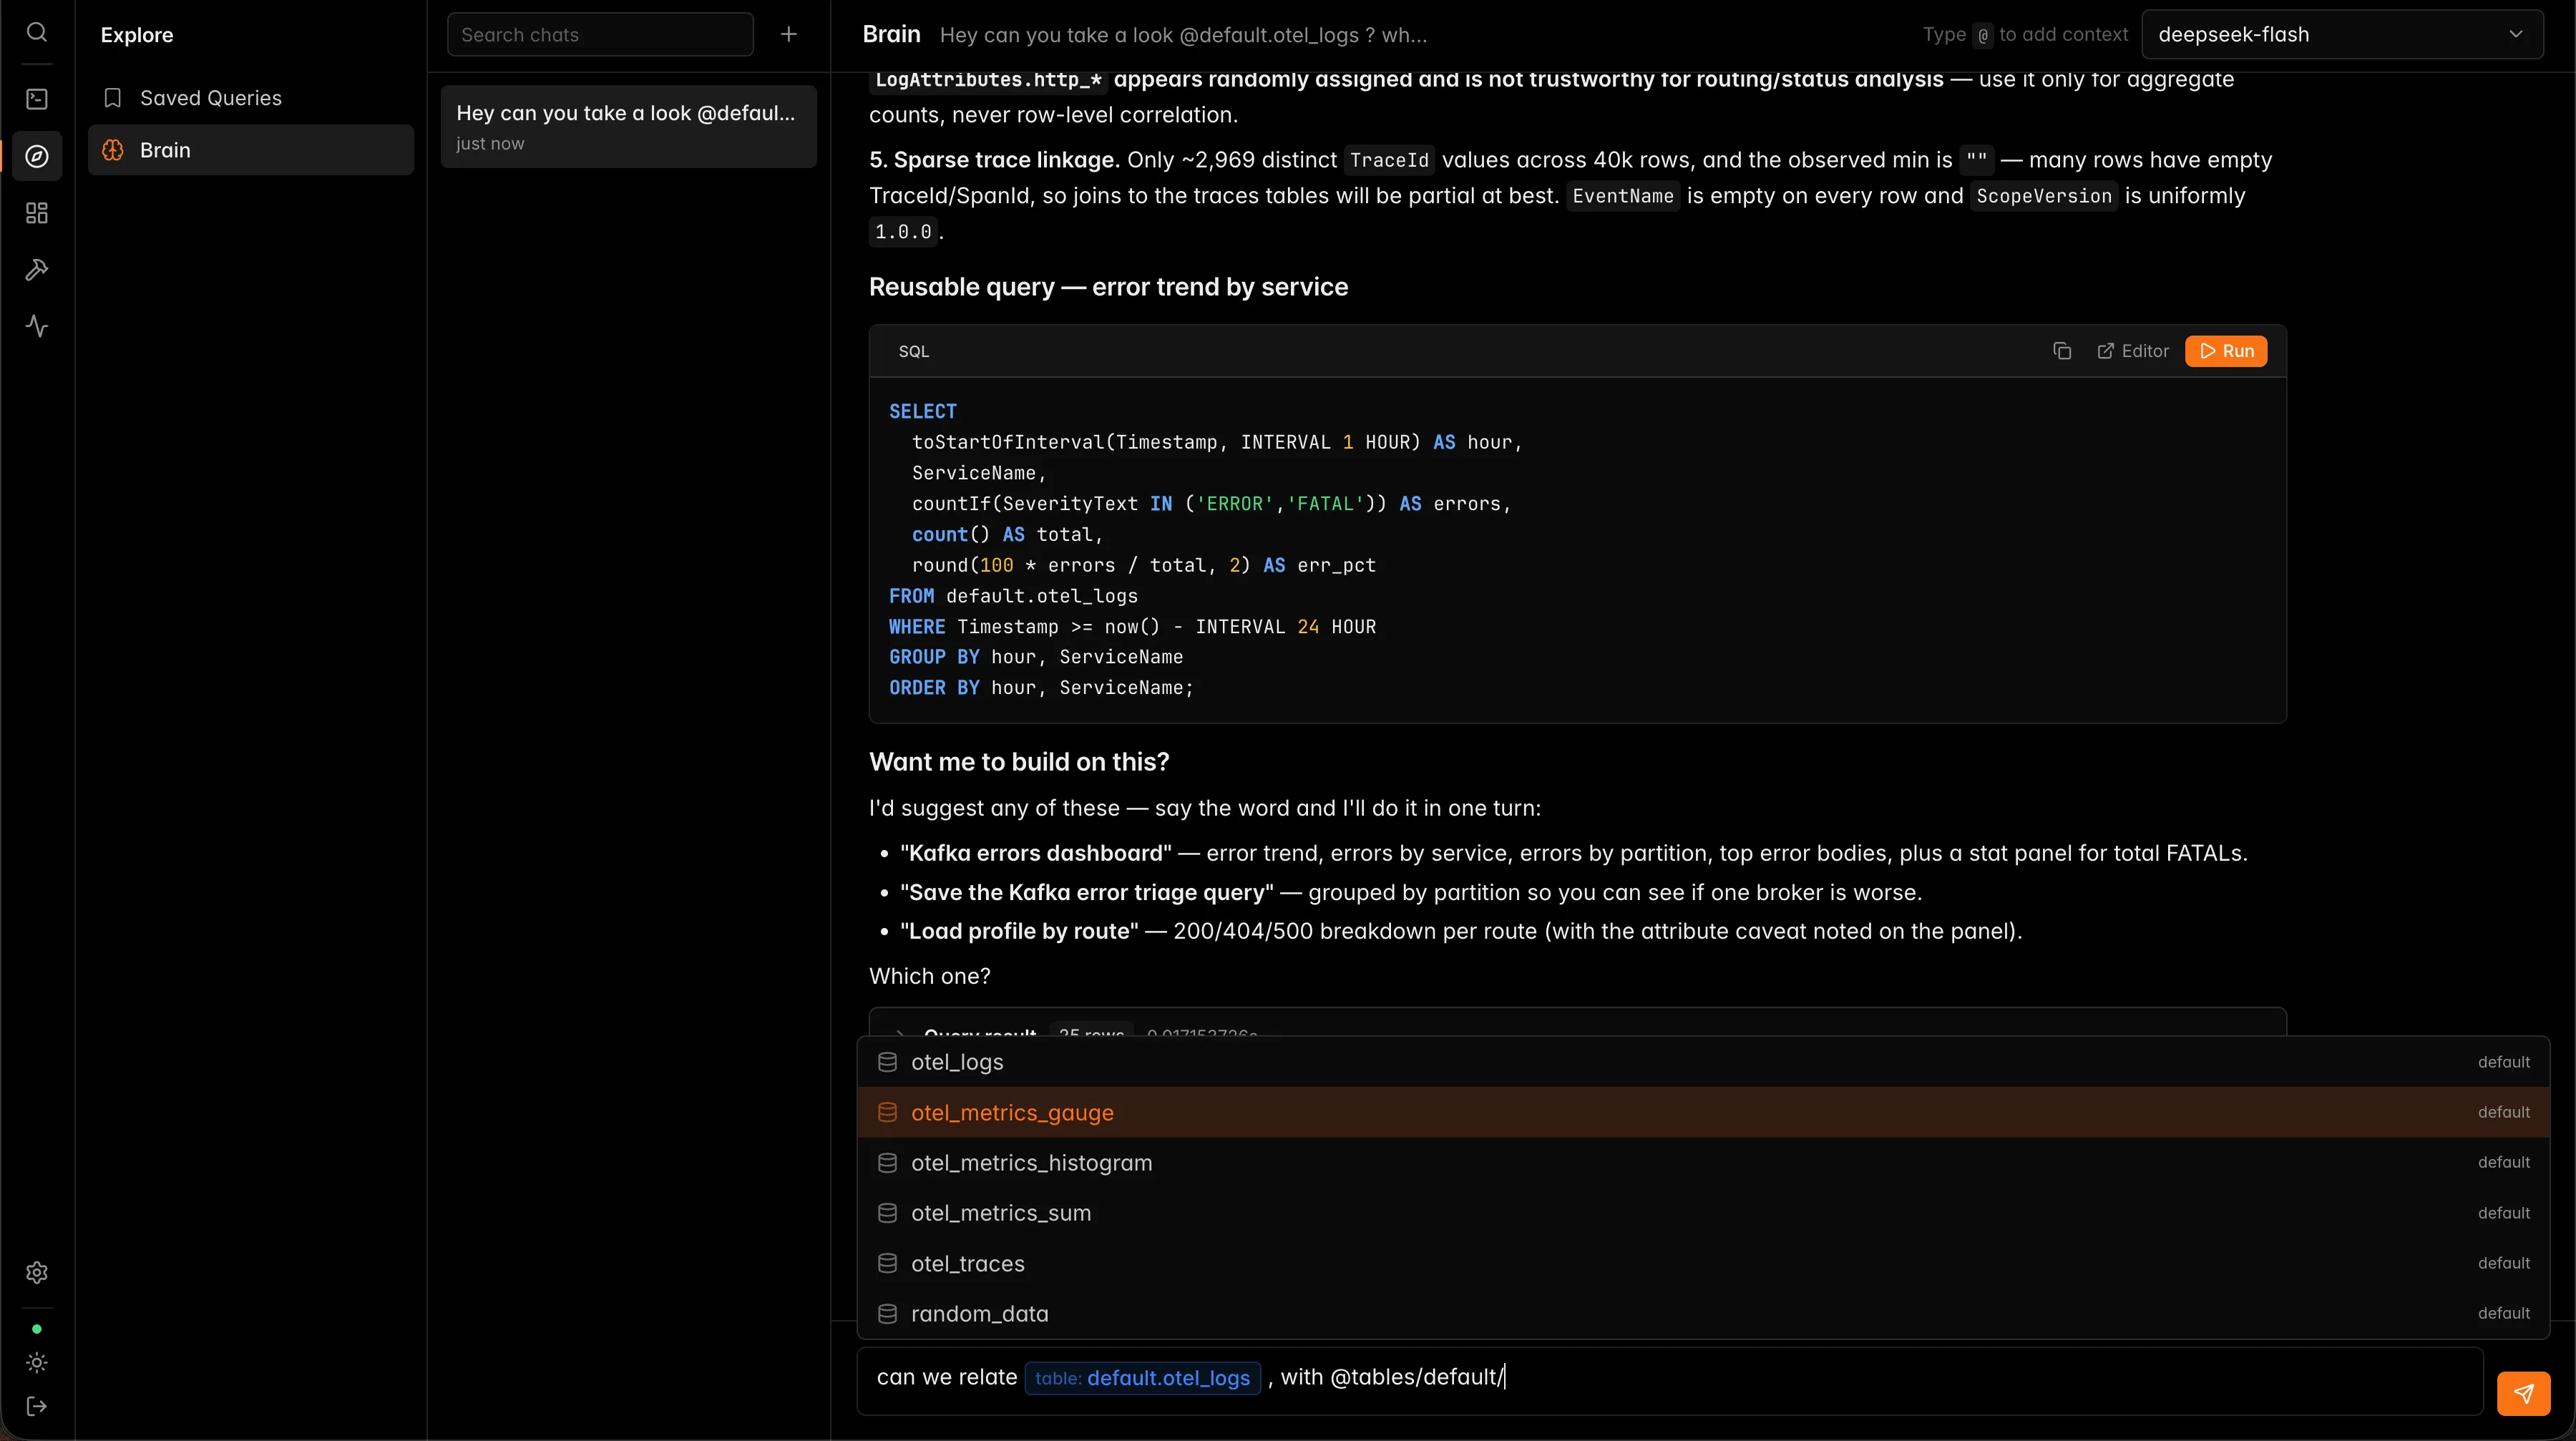
Multi-chat AI with persisted context, SQL artifacts, provider and model controls, and run-in-chat actions.Read the docs
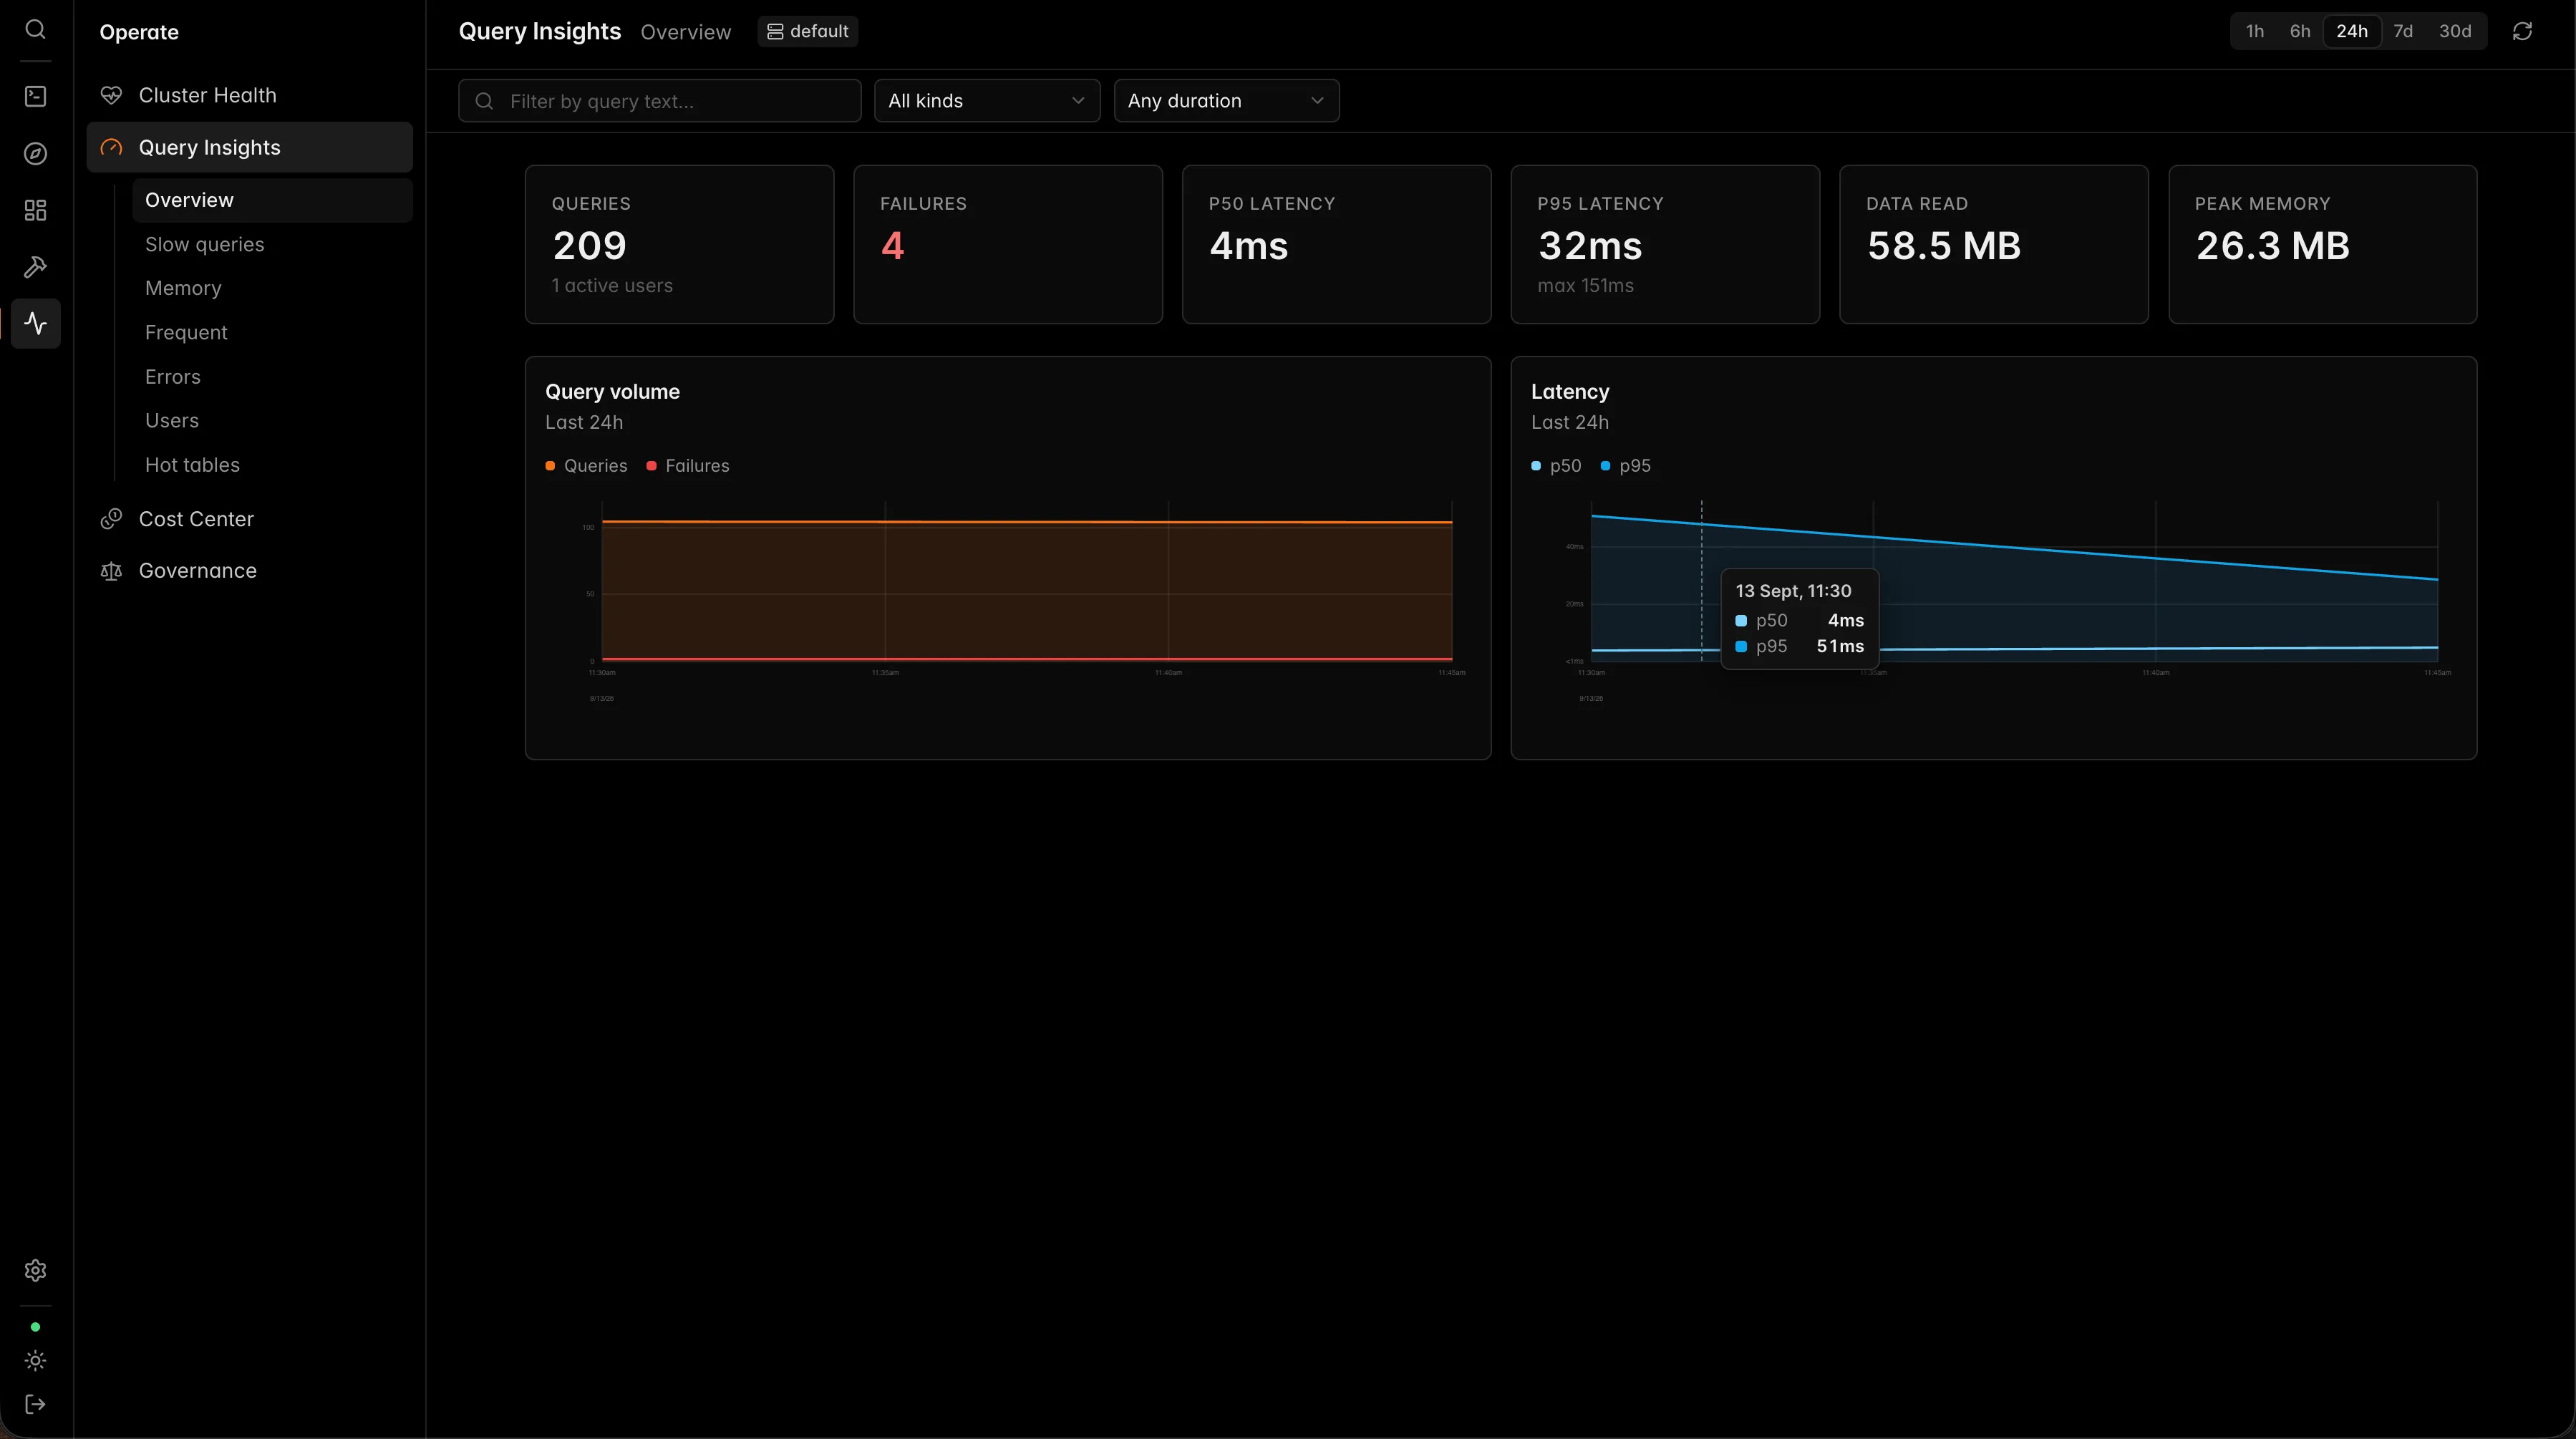
Latency percentiles, slow and memory-heavy query patterns, failures, users and hot tables, straight from system.query_log.Read the docs
Per-node replication delay, merges, mutations, parts pressure, Keeper and backups: live drill-downs with history charts.Read the docs
Dashboard metrics, access matrix, incidents, policies and sync controls.Read the docs
Schedule SQL queries with cron expressions, track execution history, and monitor results.Read the docs
ClickHouse user lifecycle, provider management, and tunnel controls.Read the docs
Ranked among the top ClickHouse GUIs in 2026 by 1bench.
What's inside
A data workbench, ClickHouse-native observability and platform controls, so a team can ship and govern from one place.
Ingest
CH-UI receives logs, traces and events over HTTP, keeps them on disk, and writes them to ClickHouse. Part of the free core.
OTLP over HTTP for logs and traces, JSON events, the Elasticsearch bulk API and Splunk HEC. Change the host and key in the config you have; Send data here fills in the snippet.
A 200 means the request is fsynced to a local spool. If ClickHouse is down, the data waits and retries. Dedup tokens keep a replayed batch from landing twice.
Parse JSON, logfmt, regex, nginx, Apache or syslog, map fields and filter, with a before and after preview. With Pro: sample, redact, and route one stream to up to 8 tables.
Logs and traces land in the OpenTelemetry exporter's table layout, so Telemetry searches them with no extra setup. Events go to a table of their own.
Works with
Architecture
The server runs where you put it. A lightweight connector sits next to ClickHouse and dials out, so the cluster never needs a public port.
Pricing
Editor, dashboards, pipelines, ingest, models, Brain chat, query history, telemetry logs and the MCP server. Unlimited users, forever.
Query Insights, Cluster Health, Cost Center, Governance, Alerts, SSO, scheduled query jobs, traces and metrics, pipeline sampling, redaction and routing, Ask AI, audit forwarding and GitHub sync. Flat, never per seat, activated with a key, no call-home.
Multiple instances, volume pricing, invoice billing, security review and custom terms.
Questions
CH-UI is the open-source control plane for ClickHouse: SQL editor, dashboards, pipelines, dbt-style models, governance, cluster monitoring, and the Brain AI copilot in one workspace. It ships as a single self-hosted binary that stores its state in a local SQLite database, with no external services to operate.
Yes. The core is open source under Apache-2.0 and free forever, with unlimited users: SQL editor with query history and query parameters, saved queries, dashboards with shareable links, pipelines with parse, map and filter steps, the ingest endpoints for logs, traces and events, models with cron schedules, telemetry logs, Brain AI chat (bring your own AI key), the MCP server for AI clients, the admin panel with multiple connections, and the tunnel connector. Only the Pro modules require a paid license.
A Pro license ($1,199/year per instance, flat, never per seat) unlocks Query Insights, Cluster Health, Cost Center, Performance, Governance, Alerts, scheduled query jobs, fleet overview, schema comparison, weekly reports, telemetry traces, metrics, service map and monitors, pipeline sampling, redaction and routing, Ask AI and Brain agentic tools, GitHub sync for models, SSO/OIDC, audit forwarding to your SIEM, and priority support. You can try everything free for 30 days, no card required.
Yes. Point the OpenTelemetry Collector or an OTel SDK (OTLP over HTTP), Filebeat, Logstash, Fluent Bit or Vector (Elasticsearch bulk API), or any Splunk HEC client at CH-UI with an ingest key. Each request is written to an on-disk spool before CH-UI answers, then a pipeline writes it to ClickHouse in the OpenTelemetry table layout that Telemetry reads. Ingest is part of the free core; sampling, redaction and routing to several tables are Pro.
On your infrastructure. CH-UI is self-hosted, keeps its state in a local SQLite file, and the connector reaches ClickHouse over an outbound-only WebSocket tunnel, so your cluster never needs a public port. The Pro license is verified locally with no call-home, so air-gapped deployments work.
One binary (or Docker) and a ClickHouse instance to connect to. No external database. Download the release, run ch-ui, and the UI is on localhost:3488. If ClickHouse lives on another host, run the lightweight ch-ui connect connector next to it with outbound-only traffic. Binaries ship for Linux, macOS and Windows; ch-ui desktop runs a personal copy on your own computer, listening on 127.0.0.1 only.
The core is Apache-2.0, free for commercial use. Pro modules are source-available under the Business Source License 1.1 and unlock with a signed license file: a flat annual subscription via Stripe, one license per running instance, activated offline in Settings → Instance → License.
One command to self-host. The docs cover installation, deployment, the API and operations.